|
|
|
|
- Home
- Holidays
- Time Zones
- Lottery
- My Numbers
- Unemployment
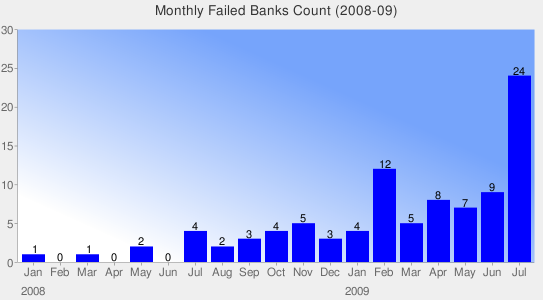
- Bank Failures
- Tablets Help
- Awards & Winners


|
|
| Home | Calendars | Timezones | Bank Failures | Employment | Lottery |
| PortalSeven.com | EMI Calculator | US Banks Directory | Canada Transit Numbers | |
| Copyright © 2024 PortalSeven.com | Disclaimer | Privacy Policy | Feedback | Contact Us |